
使用Nagios监控Eucalyptus云平台
发表时间:2013-01-24 21:50:22简介
和运行在数据中心里的任何生产系统一样,用于生产环境的Eucalyptus私有云需要一个健康监测系统。健康监测系统的功能是使得系统管理员能够及时了解资源使用状况,未来的发展趋势,并在资源池(服务器、网络、存储等等)出现问题的情况下提供可靠的真短信息。我们在我们自己的生产系统当中使用Nagios来对Eucalyptus云平台进行监控。如果您所部署的Eucalyptus云平台还没有任何监控系统,我们推荐您也使用Nagios来对Eucalyptus云平台进行监控。
Nagios是一个开放源代码的IT资源监控系统,可以从Nagios的网站或者其他开源软件仓库获得。在Nagios的网站上对Nagios的介绍如下:
"Nagios是一个强大的监控系统。它使得企业能够及时发现并解决IT设施中存在的问题,以免关键性业务流程受到影响。(Nagios is a powerful monitoring system that enables organizations to identify and resolve IT infrastructure problems before they affect critical business processes.)"
在这个文档中,我们通过一些简单的步骤来介绍如何利用Nagios来监控一个运行在CentOS或者RHEL 6上的Eucalyptus系统。
步骤一:安装配置Eucalyptus
在这个文档中,我们将跳过如何安装配置Eucalyptus。如果您需要帮助的话,您可以参考《在CentOS 6.3上安装Eucalyptus》这个教程。
步骤二:Nagios快速安装
如果你是按照Eucalyptus的官方文档通过软件仓库安装了Eucalyptus的话,我们已经为您添加了安装Nagios所需要的软件仓库。在所有运行Eucalyptus组件的服务器上,用如下命令安装Nagios NRPE插件:
# yum install nrpe nagios-plugins-all
然后,在一台我们称为“Nagios前端服务器”的主机上安装Nagios软件包:
# yum install nagios
Nagios的安装就这么简单。
步骤三:Nagios简单配置
在将Nagios投入使用之前,我们需要进行一些简单的配置。需要说明的是,在如下教程中,我们假定在整个系统中只有一台Nagios前端服务器。也就是说,所有被监控主机上的监控配置都是一致的,这样我们就不需要为每台主机维护一个专有的配置文件。
在所有被监控主机上进行如下设置,允许Nagios前端服务器与被监控主机上的NRPE守护进程进行交互:
- 编辑文件 /etc/nagios/nrpe.cfg
- 将 'allowed_hosts=127.0.0.1' 修改为 'allowed_hosts=<ip address of your nagios server>'
- 在该配置文件的末尾,修改如下监控参数
command[check_users]=/usr/lib64/nagios/plugins/check_users -w 5 -c 10

command[check_load]=/usr/lib64/nagios/plugins/check_load -w 15,10,5 -c 30,25,20

command[check_disk]=/usr/lib64/nagios/plugins/check_disk -w 20% -c 10% -p /

command[check_procs]=/usr/lib64/nagios/plugins/check_procs -w 250 -c 400 -s RSZDT

command[check_swap]=/usr/lib64/nagios/plugins/check_swap -w 20% -c 10%
- 使用命令 'service nrpe start' 启动NRPE守护进程
接下来,在Nagios前端服务器上进行如下设置以启用NRPE,以及允许Nagios从一个本地文件夹中读取远程被监控节点上的配置文件,这些配置文件提供了每一个Eucalyptus节点的配置信息:
- 编辑文件 /etc/nagios/nagios.cfg
- 取消这一行前面的注释符号 'cfg_dir=/etc/nagios/servers' ,然后保存文件
- 创建目录 /etc/nagios/servers
- 编辑文件 /etc/nagios/objects/commands.cfg ,在文件的末尾添加如下内容,然后保存文件
define command { command_name check_nrpe command_line /usr/lib64/nagios/plugins/check_nrpe -H $HOSTADDRESS$ -c $ARG1$ }
- 运行命令 'htpasswd -bc /etc/nagios/passwd nagiosadmin nagios' 将Nagios管理员的密码设置为 'nagios'(建议您选择一个您自己定义的密码)
接下来,在Nagios前端服务器上为每一个Eucalyptus节点创建一个配置文件,这个配置文件定义了被监控主机的入口(end-point)以及需要监测的参数(服务)。所有被监控主机的的配置文件都需要存放在 /etc/nagios/servers 这个目录下 。下面是一个配置文件的例子,需要注意的是您需要将'host'部分的address设置为被监控节点的IP地址。
###############################################################################

###############################################################################

#

# HOST DEFINITION

#

###############################################################################

###############################################################################

# Define a host for the local machine

define host{

 use linux-server

 host_name my-cloud-controller

 alias Cloud Controller

 address 10.102.1.24

 check_interval 1

 }

###############################################################################

###############################################################################

#

# SERVICE DEFINITIONS

#

###############################################################################

###############################################################################

# Define a service to "ping" the local machine

define service{

 use local-service ; Name of service template to use

 host_name my-cloud-controller

 service_description PING

 check_command check_ping!100.0,20%!500.0,60%

 }

# Define a service to check the disk space of the root partition

# on the local machine. Warning if < 20% free, critical if

# < 10% free space on partition.

define service{

 use generic-service ; Name of service template to use

 host_name my-cloud-controller

 service_description Root Partition

 check_command check_nrpe!check_disk

 }

# Define a service to check the number of currently logged in

# users on the local machine. Warning if > 20 users, critical

# if > 50 users.

define service{

 use generic-service ; Name of service template to use

 host_name my-cloud-controller

 service_description Current Users

 check_command check_nrpe!check_users

 }

# Define a service to check the number of currently running procs

# on the local machine. Warning if > 250 processes, critical if

# > 400 users.

define service{

 use generic-service ; Name of service template to use

 host_name my-cloud-controller

 service_description Total Processes

 check_command check_nrpe!check_procs

 }

# Define a service to check the load on the local machine.

define service{

 use generic-service ; Name of service template to use

 host_name my-cloud-controller

 service_description Current Load

 check_command check_nrpe!check_load

 }

# Define a service to check the swap usage the local machine.

# Critical if less than 10% of swap is free, warning if less than 20% is free

define service{

 use generic-service ; Name of service template to use

 host_name my-cloud-controller

 service_description Swap Usage

 check_command check_nrpe!check_swap

 }

# Define a service to check SSH on the local machine.

# Disable notifications for this service by default, as not all users may have SSH enabled.

define service{

 use generic-service ; Name of service template to use

 host_name my-cloud-controller

 service_description SSH

 check_command check_ssh

 notifications_enabled 0

 }
将所有被监控节点的配置文件都创建完毕后,使用如下命令在Nagios前端服务器上启动Nagios:
service httpd start

service nagios start
现在Nagios应该处于运行状态并为您的系统提供基本的监测服务了。 您可以通过浏览器访问Nagios的用户界面(默认的URL地址为http://ip_address/nagios),登录时使用的用户名是'nagiosadmin',密码是'nagios'(或者您刚刚设定的其他密码)。为了验证基本的监控功能已经正常运转,我们可以看一下'hosts'和'services'部分是否显示了我们在配置文件中所定义的所有主机和服务。当我们刚刚启动Nagios的时候,Nagios需要几分钟的时间从被监控主机上提取必要的信息,大概五分钟之后我们可以看到服务的状态从'PENDING'变更为'OK'(或者是'WARNING'或者'CRITICAL')。
步骤四:Eucalyptus相关配置
到目前为止,我们已经有了一个可以用来管理和维护Eucalyptus部署环境的监控工具。我们能够及时得知网络的通畅状况(up / down),磁盘的使用状况(free / full),负载的具体状况(low / high)等等在大多数情况下都需要了解的信息。接下来,我们添加一些与Eucalyptus相关的监测参数,这些监测参数使用Nagios自带的日志文件监测程序(logfile checker)来对Eucalyptus服务进行基本的健康状况监控。
- 编辑文件 /etc/nagios/nrpe.cfg
- 增加如下监控参数的定义
# Eucalyptus checks

  command[check_cclog]=/usr/lib64/nagios/plugins/check_log -F /opt/eucalyptus/var/log/eucalyptus/cc.log -O /tmp/nagioscc.log -q "ERROR|FATAL"

  command[check_ccfaults]=/usr/lib64/nagios/plugins/check_log -F /opt/eucalyptus/var/log/eucalyptus/cc-fault.log -O /dev/null -q "ERR-"

  command[check_nclog]=/usr/lib64/nagios/plugins/check_log -F /opt/eucalyptus/var/log/eucalyptus/nc.log -O /tmp/nagiosnc.log -q "ERROR|FATAL"

  command[check_ncfaults]=/usr/lib64/nagios/plugins/check_log -F /opt/eucalyptus/var/log/eucalyptus/nc-fault.log -O /dev/null -q "ERR-"

  command[check_cloudlog]=/usr/lib64/nagios/plugins/check_log -F /opt/eucalyptus/var/log/eucalyptus/cloud-output.log -O /tmp/nagioscloud.log -q "ERROR|FATAL"

  command[check_cloudfaults]=/usr/lib64/nagios/plugins/check_log -F /opt/eucalyptus/var/log/eucalyptus/cloud-fault.log -O /dev/null -q "ERR-"

  command[check_walrusfaults]=/usr/lib64/nagios/plugins/check_log -F /opt/eucalyptus/var/log/eucalyptus/walrus-fault.log -O /dev/null -q "ERR-"

  command[check_scfaults]=/usr/lib64/nagios/plugins/check_log -F /opt/eucalyptus/var/log/eucalyptus/sc-fault.log -O /dev/null -q "ERR-"
- 保存如上文件,并将发布为所有Eucalyptus节点上的 /etc/nagios/nrpe.cfg
接下来,修改 /etc/nagios/servers 目录下与每个被监控主机相关的配置文件,添加与特定被监控主机相关的监控参数(例如,在Cloud Controller主机的配置文件中添加Cloud Controller监控参数,在Walrus主机的配置文件中添加Walrus监控参数,在Cluster Controller主机的配置文件中添加Cluster Controller监控参数,以此类推)。您可以从下列监控参数中拷贝您所需要的监控参数,并将其粘贴到相对应的被监控主机配置文件中。需要注意得失,当您往被监控主机配置文件中粘贴监控参数的时候, 'host_name' 字段的内容需要与本配置文件中的'host'部分所定义的host_name保持一致。
## Cloud Controller Checkers

define service{

 use generic-service ; Name of service template to use

 host_name my-cloud-controller

 service_description Cloud Logs

 check_command check_nrpe!check_cloudlog

 }

define service{

 use generic-service ; Name of service template to use

 host_name my-cloud-controller

 service_description Cloud Faults

 check_command check_nrpe!check_cloudfaults

 }

## Walrus Checkers

define service{

 use generic-service ; Name of service template to use

 host_name my-walrus

 service_description Walrus Logs

 check_command check_nrpe!check_cloudlog

 }

define service{

 use generic-service ; Name of service template to use

 host_name my-walrus

 service_description Walrus Faults

 check_command check_nrpe!check_walrusfaults

 }

## Storage Controller Checkers

define service{

 use generic-service ; Name of service template to use

 host_name my-storage-controller

 service_description SC Logs

 check_command check_nrpe!check_cloudlog

 }

define service{

 use generic-service ; Name of service template to use

 host_name my-storage-controller

 service_description SC Faults

 check_command check_nrpe!check_scfaults

 }

## Cluster Controller Checkers

define service{

 use generic-service ; Name of service template to use

 host_name my-cluster-controller

 service_description Cluster Controller Logs

 check_command check_nrpe!check_cclog

 }

define service{

 use generic-service ; Name of service template to use

 host_name my-cluster-controller

 service_description Cluster Controller Faults

 check_command check_nrpe!check_ccfaults

 }

## Node Controller Checkers

define service{

 use generic-service ; Name of service template to use

 host_name my-node-controller

 service_description Node Controller Logs

 check_command check_nrpe!check_nclog

 }

define service{

 use generic-service ; Name of service template to use

 host_name my-node-controller

 service_description Node Controller Faults

 check_command check_nrpe!check_ncfaults

 }
最后,在Nagios前端服务器上重启nagios服务,并在所有的被监控节点上重启NRPE服务,然后刷新浏览器界面。
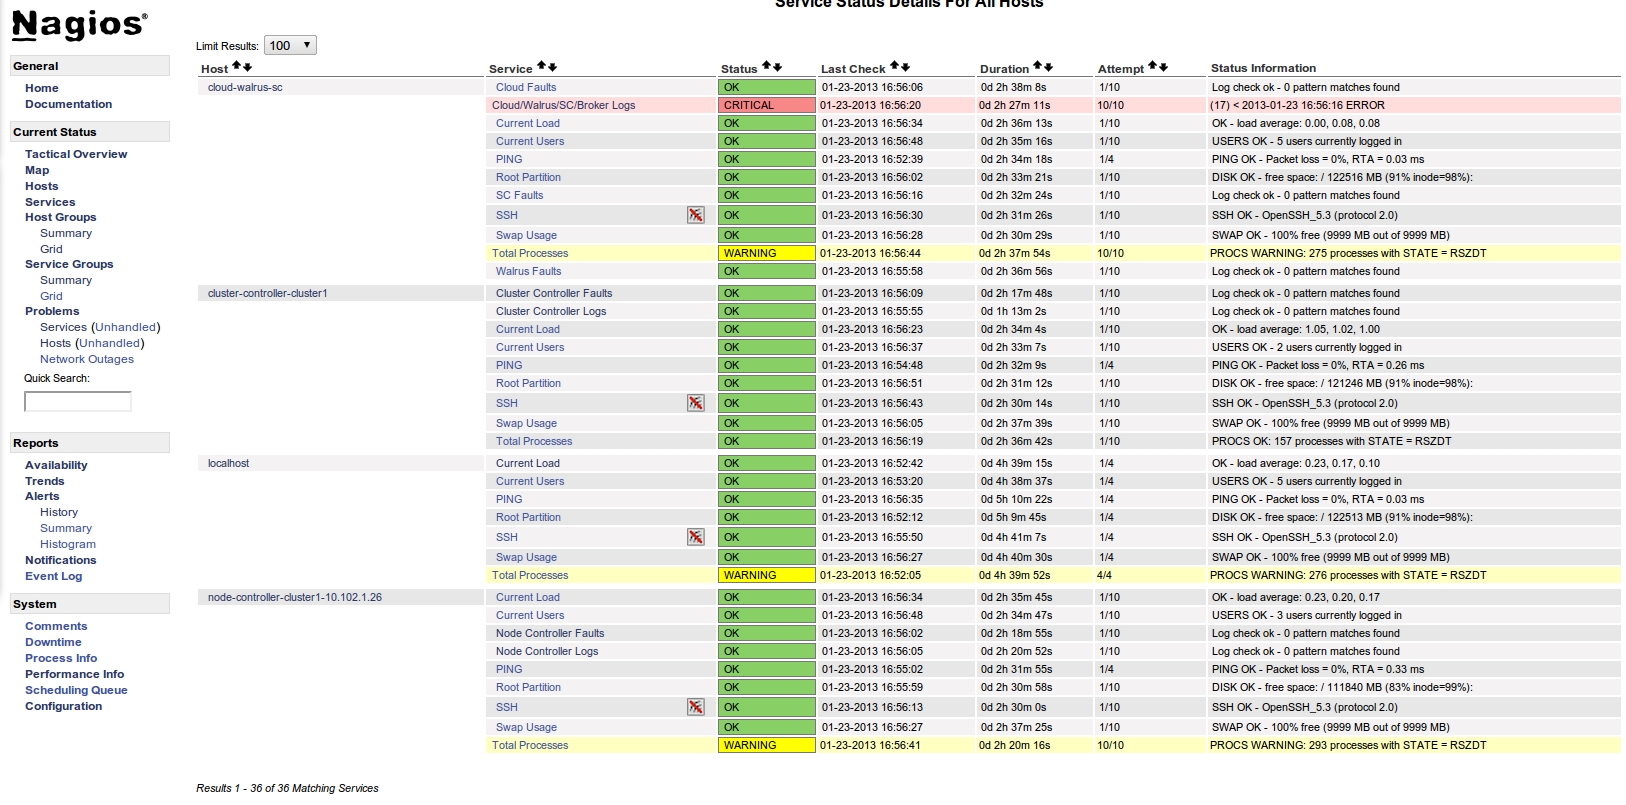
步骤五:使用Nagios
下面是使用Nagios对Eucalyptus私有云进行监控的一个屏幕截图。在这个屏幕截图中,被监控主机cloud-walrus-sc上出现了一个CRITICAL级别的错误信息,这是因为我们故意地向Cloud Controller发送了一个非法请求。(点击图片可以看到大图。)
后续配置
我们可以对Nagios进行配置,使得Nagios在某些监控参数出现错误的时候自动地以特定的频率向特定的电子邮件地址发送报警信息。此外我们还可以对监控频率、报警阈值(例如在发送报警信息之前需要经历过多少次监控错误)、以及其他参数进行配置。您可以参考 Nagios 文档 以了解如何对Nagios进行更进一步的配置。
译者注:本文档翻译自Eucalyptus公司共同创始人Daniel Nurmi的博客。原文的出处是:
http://nurmiblog.wordpress.com/2013/01/24/eucalyptus-and-nagios/
| 上一篇 | 下一篇 |
| 姓名: | |
| 评论: | |
|
请输入下面这首诗词的作者姓名。 箫声咽,秦娥梦断秦楼月。 |
|
| 答案: | |
云与清风常拥有,
冰雪知音世难求。
击节纵歌相对笑,
案上诗书杯中酒。
2000.12.31 于 洛杉矶